Gráfico del Ibex35
Adjunto un gráfico en mensual, sobre nuestro querido índice, en el que nos deja claro cuales son las referencias a vigilar.
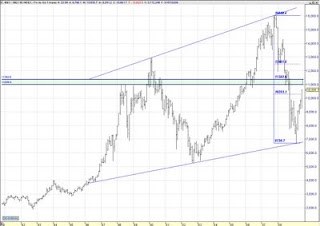
We use cookies to help you navigate efficiently and perform certain functions. You will find detailed information about all cookies under each consent category below.
The cookies that are categorized as "Necessary" are stored on your browser as they are essential for enabling the basic functionalities of the site. ...
Necessary cookies are required to enable the basic features of this site, such as providing secure log-in or adjusting your consent preferences. These cookies do not store any personally identifiable data.
Functional cookies help perform certain functionalities like sharing the content of the website on social media platforms, collecting feedback, and other third-party features.
Analytical cookies are used to understand how visitors interact with the website. These cookies help provide information on metrics such as the number of visitors, bounce rate, traffic source, etc.
Performance cookies are used to understand and analyze the key performance indexes of the website which helps in delivering a better user experience for the visitors.
Advertisement cookies are used to provide visitors with customized advertisements based on the pages you visited previously and to analyze the effectiveness of the ad campaigns.
No se que decirte. El gráfico que has puesto de muy largo plazo y no se ven los detalles.
De momento las bolsas son muy alcistas, ahora toca corregir y si el SP500 no pierde definitivamente los 940 lo mas probable es que todo siga subiendo. Fíjate en la siguiente entrada: http://tototrade.co.cc/2009/07/cerrado-el-hueco/. El cierre del hueco por Nasdaq es un señal muy importante. En mi opinión las bolsas seguirían subiendo hasta el primer trimestre del año que viene.